
Google Analytics Dashboard Reports Explained”
 Dear Rich’s Web Design Clients:
As a client of Rich’s Web Design you will be receiving a monthly report from Google Analytics in PDF format around the first day of EACH month. Google Analytics is the industry’s leading web statistics application that will show you valuable statistics (good and bad) about visitors to your own web site.
It will show you the number of visitors your site received the previous month, what search phrases they used to find your site, how many visitors “bounced” (left after only viewing 1 page), how many people filled out your Contact Us form (if applicable), what mobile devices they used to view your site, what landing pages visitors entered your site from their searches, what cities / countries your searches originated from, what social media sites sent visitors and other details. If you see ‘there is no data‘, that means that you need to make more posts on Facebook, etc. with links to your web site; In other words you need to use Facebook, Twitter, LinkedIn, Yelp, etc. to help drive traffic to your site!
If your WordPress site has a ‘Site Search’ capability, then the terms that your visitors search for will show up in the ‘On-Site Search Terms’ box. These are NOT from Google, but within your own site.
If you see in any section of these reports ‘(not provided)’, this simply means that … the user / searcher is signed in to a Google account, or using the Firefox search bar. This can be a bit frustrating, as it can be a large portion of your ‘Search Term’ statistics. Google has their own reason why they do not want Google Analytics to share this information in the reporting metrics. As you can see in the below example, the ‘(not provided)’ line is the largest in the ‘Searched Keywords’ section.
BELOW you will see an example of a client report with RED arrows and explanations in RED so that each section is very understandable. Take a look!
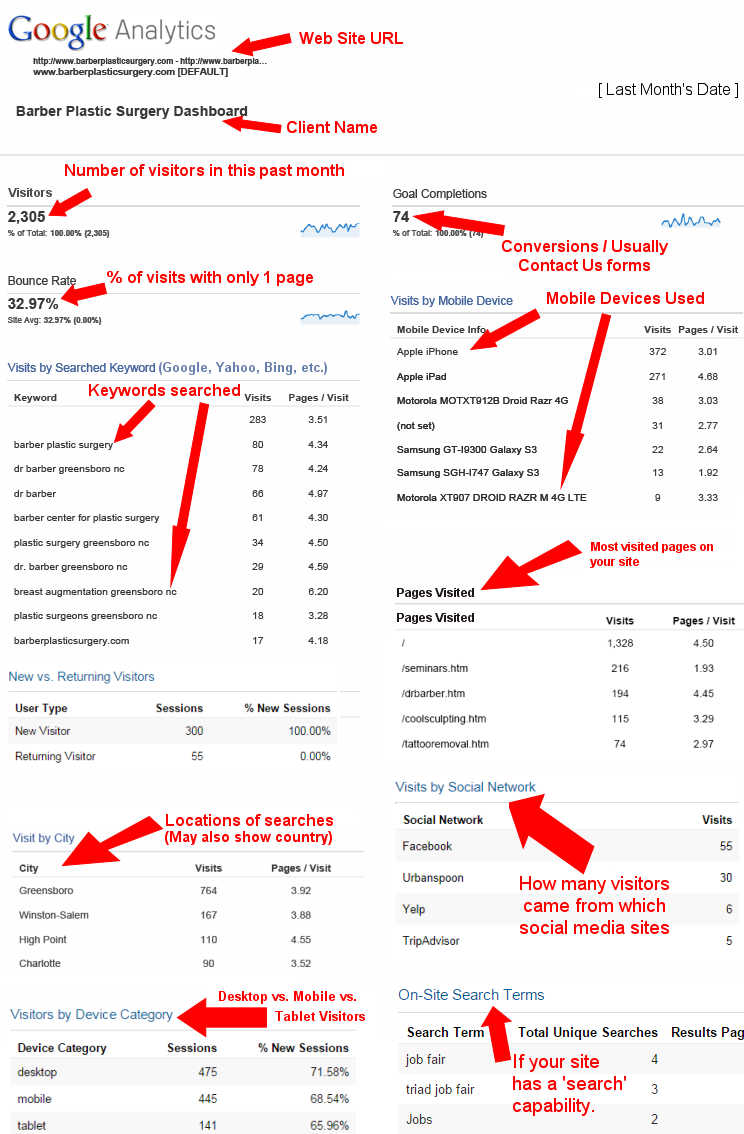
For those of you who have “Contact Us” types of forms on your site, it will show you how many people sent you these. These are shown on your report as “ Goal Conversions”.
I hope these monthly Dashboard reports will show you valuable stats about visitors to your site and what phrases we can emphasize differently. If you would like to continue to receive these reports, you do not need to do a thing, except that I ask that you take just a little bit of time to view these. You may not understand the first month’s reports, but once you receive 3 or 4, they will really start to make sense.
Some monthly reports include a PDF report from Google Search Console, formery Google Webmaster Tools, called ‘Analytics Queries‘. The Search Queries page provides information about Google Web Search queries that have returned pages from your site. In addition, you can also see information about the pages on your site that were seen most often in search results (top pages). This is a report that is produced not from your actual web stats, but from Google Webmaster Tools about searches that are related to the terms Google believes are related to our site. The report includes terms such as ‘query list’, ‘impressions’, ‘clicks’, ‘CTR’, ‘average position’, etc. For a full explanation of these terms, go to this page – Google Webmaster Report Terms.
I have also set these up so that if you so desire, I can send you the login info and you can view these stats whenever you desire. You just will need to ask.
Here a few terms you should know. You’ll see them often in your Google Analytics data:
| Dimensions—A dimension is a descriptive attribute or characteristic of an object that can be given different values. Browser, Exit Page, Screens and Session Duration are all examples of dimensions that appear by default in Google Analytics. It is also a specific attribute or characteristic of an object that can be given different values. For example, San Francisco is an attribute of the Dimension ‘City name’. Generally, dimensions are used to help organize specific data points, known as metrics.
Secondary Dimension: similar to a segment, this is a Google Analytics specific term for adding in another dimension to a report, breaking down the first dimension (ex. Country), by a second dimension (ex. traffic source). Segment: a subset of your data set, narrowed down to a particular behavior, traffic source, geography, or other defining factor. You can add these into standard analytics reports to slice & dice your data for a more specific view. Metrics—Metrics are individual elements of a dimension that can be measured as a sum or a ratio. Screenviews, Pages/Session and Average Session Duration are examples of metrics in Google Analytics. Continuing with the city example, you could use metrics such as Area and Population to describe the city dimension. See the chart below for a more detailed example of dimensions and metrics. Sessions—A session is the period of time a user is actively engaged with your website, app, etc., within a date range. All usage data (Screenviews, Events, Ecommerce, etc.) is associated with a session. Also a Session is a group of interactions (pageviews, events, etc) that take place on your website within a given time frame. Generally a session has a time-based expiration of 30 minutes of inactivity after the last action. A session also ends at midnight in some analytics tools (Google Analytics included). Note that a session may also end if a user comes back to your website via a different campaign, even within the 30 minutes time interval. Users—Users who have had at least one session within the selected date range. Includes both new and returning users. Users (or visitors) refers to the number of users (or more accurately, cookies/browsers) interacted with your website content within a specific date range Pageviews—Pageviews means the total number of pages viewed. Repeated views of a single page are counted. Pages/Session—Pages/session (Average Page Depth) is the average number of pages viewed during a session. Repeated views of a single page are counted. Avg. Session Duration—The average length of a session. Bounce Rate—Bounce rate is the percentage of single-page visits (i.e., visits in which the person left your site from the entrance page without interacting with the page). New Sessions—An estimate of the percentage of first-time visits. Goals—Goals let you measure how often users take or complete specific actions on your website. Conversions—Conversions are the number of times goals have been completed on your website. Campaigns—Campaigns (also known as custom campaigns) allow you to add parameters to any URL from your website to collect more information about your referral traffic. Acquisition—Acquisition is how you acquire users. Behavior—Behavior data helps you improve your content. Event: generally an action taken on your site, i.e. download, form submit, video view Hit: a hit is any server call that corresponds to the javascript firing on a webpage or app and sent to an analytics tool. For example, you can have hits for page, event, ecommerce, and social interactions. |
Another good explanation of Google Analytics – http://www.socialmediaexaminer.com/google-analytics-basics/
Google Analytics: Your Data Processor
![]()
Under the GDPR, if you use Google Analytics, then Google is your Data Processor. Your organization is the Data Controller since you control which data is sent to Google Analytics.
With Google as your Data Processor, they have obligations to conform to the EU GDPR. According to Google’s own Privacy Compliance website, they are “working hard to prepare for the EU’s General Data Protection Regulation.” You can see more details on this site and it is almost certain that Google Analytics will be fully compliant by May 25, 2018.
Google’s Commitment to GDPR
Google is working hard to prepare for the EU’s General Data Protection Regulation (GDPR). Keeping users’ information safe and secure is among their highest priorities at Google. Over the years, they have spent a lot of time working closely with Data Protection Authorities in Europe, and we have already implemented strong privacy protections that reflect their guidance. Google is committed to complying with the new legislation and will collaborate with partners throughout this process.
