
Monthly Reports Terms Explained
Google ‘Page Experience’ Update in May or June 2021
Monthly Reports Terms Explained
As a client of RWD, you receive a customized Monthly Report during the *1st week of each month that shows the previous month’s performance stats. It is a month-to-month running chart of the below important metrics.
Each client has different KPI’s, or Key Performance Indicators that show you & I what is working and what needs attention.

1. Monthly Visits – These are the number of monthly visitors / sessions where visitors viewed any part of your web site. This metric may not be the best in determining the performance of your site from month to month, but for some it is the easiest to understand.
2. Conversions – These are your Contact Us forms, Newsletter sign-ups, e-commerce purchases that have been set-up as your site GOALS. A conversion is reported whenever a user completes a goal or makes a purchase during a session. Each goal will report a maximum of one conversion per session, while every transaction is reported. If your site is focused on conversions, then this is one of the best metrics to evaluate!
3. Visibility – Determined by your rankings in the SERP (Search Engine Results Pages). The percentage score given to a website depends on its rank across a set of keywords in a search engine. In theory, if all of your phrases are in the 1st position on ALL search engines, you would have a 100% visibility score; If none of your phrases rank in the Top-30 positions, then you would have a 0% visibility. This score can be viewed best over a 3-4 month period and is HIGHLY dependent on your competition. This can also be a valuable metric for some people, but not as important as conversions.
4. Ranking +/- – This compares how many of your search phrases Moved Up vs. Moved Down in the Rankings Reports.
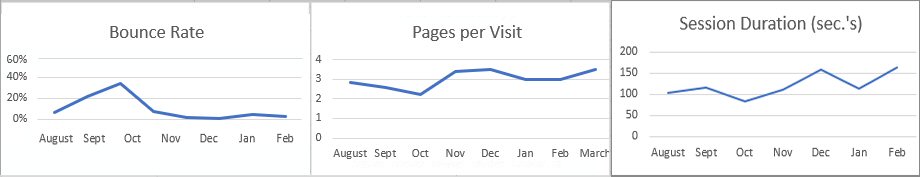
5. Bounce Rate – A website’s bounce rate is the percentage of people who leave the site from the same page they entered the site, without clicking through to any other pages. This can be a good indicator of how good a website’s navigation is, as well as an indicator of the quality of the site’s content (a very high bounce rate doesn’t bode well for either of those things). If your site is small, simply shows your basic contact info, and a visitor comes to your site for your phone number and leaves, then having a high bounce rate is not significant.
6. Pages per visit – This is the average number of pages that your visitors have seen in an average visit to your site.
7. Session Duration – The average amount of time your visitors spend on your site.
Some or most of the above items are included in your monthly results, but each client’s report is customized for your business / web site. If you use Google Ads, then your PPC stats will also be shown re: PPC visitors, PPC Conversions, etc. If your site does not need SEO, then no Ranking Visibility +/- stats will show.
Also included are insights and / or recommendations which highlight your site performance or weaknesses we need to tweak. It may mention that your site needs more reviews, fresh content, more inbound links, more postings on your social media channels (Facebook, LinkedIn, YouTube, twitter, etc.) or other significant items.
The above items can be considered KPI (Key Performance Indicators) if evaluated again your web site needs and/or goals.
Please send me your feedback & questions about these monthly reports.
* = The software I use for your SEO Rankings, reports to me on the first Wed. of each month. This is why you may receive the full report as late as the 8th or as early as the 2nd each month.

Google ‘Page Experience’ Update in May or June 2021
Here’s how Google’s new algorithm changes can affect your page rankings:
1. Google plans to update its algorithm in May or June 2021 to include a factor called Page Experience.
2. This includes existing Google Search signals such as mobile-friendliness, safe-browsing / HTTPS, and Visual stability. Visual stability has to do with preventing annoying and unexpected movement of page content..
3. It also includes metrics in Google’s Web Vitals to do with a site’s loading speed. Loading measures perceived load speed. That’s the point in the page load timeline when the main content is likely to have loaded.
Page experience isn’t everything. Now, you may have read this far and decided that the most important thing is to fix all of the above parameters. And you’ll see your traffic zoom. That won’t necessarily be the case. Google itself is pretty clear about the increased weightage they’re going to give to page experience. After all, a terrific page experience lets people get more done and increases engagement.
What’s a BAD Page Experience? Slow page loading speeds – Bad structure and design – Lack of engagement.
To Do Items
1. Optimize for mobile search – mobile devices generated 50.81% of global website traffic.
Improve page speeds –
2. Separate CTAs – Optimizing for mobile and improving page speeds are the first steps to take, as they have a huge impact on user experience. One of these is the Call to Action or CTA. Virtually every site has these in some form or another.
3. Use Alt Text / Tags for images – Alt text / tags are used in an HTML code, and it describes the appearance and function of an image on a page.